Your Rail Network Collects More Data Than Any Modern Enterprise, And Makes Worse Decisions Than Most
Hint: It's not a technology failure. It's a data architecture failure.
Hint: It's not a technology failure. It's a data architecture failure.
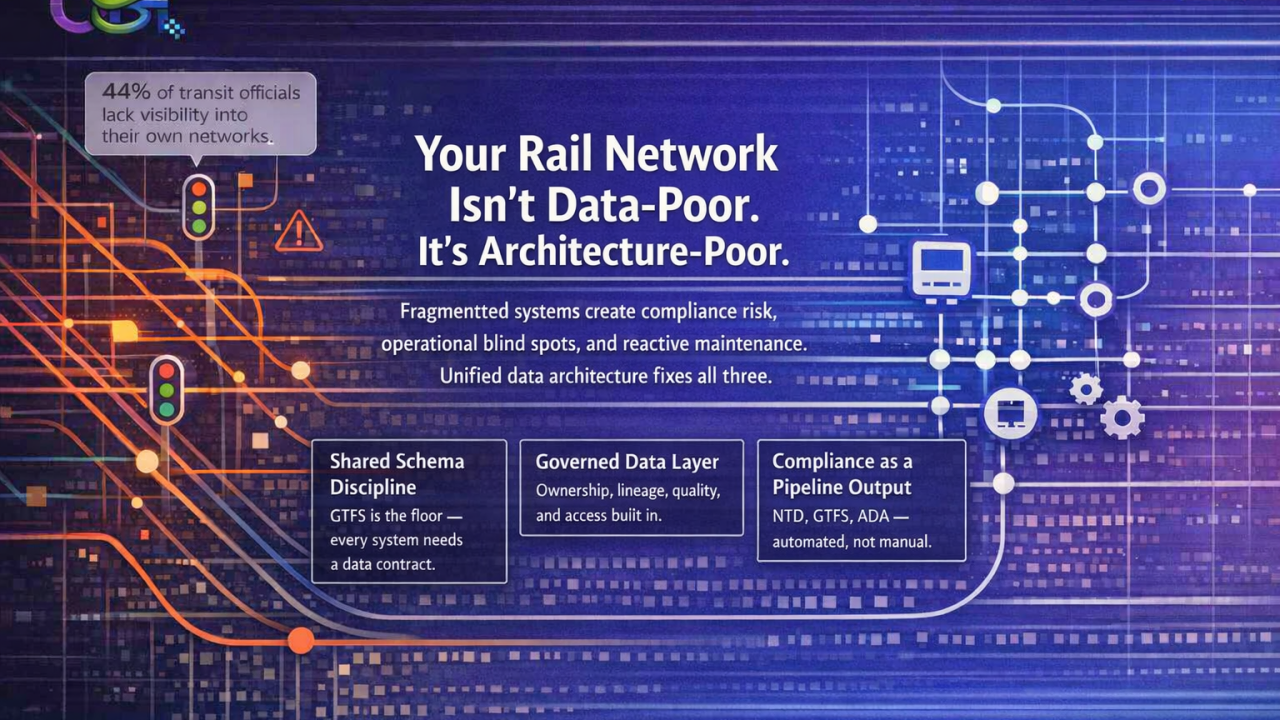
Every major US transit authority is drowning in signals. Telematics from rolling stock. Passenger flow sensors at platforms. Maintenance logs from depots. Timetable data. Asset management systems. Real-time signalling feeds. The data exists, and it multiplies every single day.
So why are 44% of transit officials unable to see what's actually happening inside their own networks? Why do a third of transit leaders identify data fragmentation as a significant barrier to sound management? Why do rail networks, operating assets with 30- to 50-year lifespans, still discover faults reactively after the disruption has already cost them passengers, budget, and credibility?
The answer isn't a lack of data. It's that the data doesn't talk to itself. And in 2025, that problem is no longer just operational. It's regulatory.
The Federal Transit Administration's National Transit Database (NTD) now requires transit agencies to submit structured, standardised data as a condition of receiving federal funding, and these requirements are tightening. For the 2025 and 2026 reporting years, the FTA has mandated new GTFS (General Transit Feed Specification) fields, expanded asset reporting categories, including ADA accessibility data, and added rail-specific infrastructure counts. Agencies that cannot cleanly extract, validate, and submit this data on schedule risk compliance failures that directly threaten their federal funding position.
California has gone further. Caltrans now publishes monthly GTFS quality reports for every transit provider in the state, visible, public scorecards of data quality. Agencies that cannot meet the California Minimum GTFS Guidelines are put on two-year improvement plans. The era of transit data as an internal, informal, "figure it out later" problem is over.
The regulatory infrastructure is now built around the assumption that transit agencies have clean, structured, interoperable data. Most don't. And the gap between what regulators expect and what most agencies can actually deliver sits within the same fragmented architecture that's been silently degrading operational performance for years.
The data doesn't talk to itself. In 2025, that problem is no longer just operational, it's regulatory.
Through working with organizations undergoing data transformation, the same three fragmentation patterns repeat across US rail and transit networks of every size:
Train operations and infrastructure management capture data independently, in incompatible formats, with no shared naming conventions or data contracts. When the FTA asks for a unified asset picture, teams scramble to reconcile spreadsheets that were never designed to align.
Maintenance teams log faults reactively. IoT telemetry and vehicle health data live in a separate platform. The bridge between "what failed" and "what is about to fail" is never built, so predictive maintenance remains a strategy slide rather than a daily operational reality.
Ticketing data, journey planning data, and real-time disruption feeds operate on different systems. Passengers experience their journey as one thing. The agencies managing it experience it as three. Dynamic rerouting, demand forecasting, and real-time capacity decisions all require these silos to collapse. Most US networks haven't started.
The cost is measurable. Agencies report maintenance windows being repeated on the same corridor because a unified data view would have bundled the work, but the work was planned in isolation. Compensation payments accumulate. And by the time an insight has been extracted, reconciled across systems, and escalated to the decision-maker, the moment to act has already passed.
Data interoperability in transit is not about buying new platforms. It's about enforcing a shared schema, a common data contract, across every system that touches your network.
GTFS is the most visible example. It's not just a file format. It's a schema: a strict definition of how routes, stops, trips, timetables, and fares must be structured so that any system can read, compare, and act on the data. Over 10,000 agencies in more than 100 countries have adopted it, not because they had to, but because the moment data follows a consistent schema, it becomes usable across every downstream system simultaneously.
When a US transit agency enforces schema discipline across its core data, here is the class of decisions that immediately improves:
Every quarter a US transit agency delays data unification, it pays a compounding cost: repeated maintenance windows, reactive fault response, manual NTD reconciliation, and growing exposure to regulatory non-compliance. The connected rail market is growing from $38 billion today toward $51 billion by 2030. The investment is already flowing. The question is whether your data architecture can absorb it, or whether new tools will simply land on top of the same fragmented foundation and produce the same fragmented results.
The data exists. The regulatory mandate exists. The performance gap is visible in every public dashboard. What's missing, in most cases, is the architecture that connects it.
New tools landing on top of a fragmented foundation produce the same fragmented results.
GTFS is the floor, not the ceiling. Every internal system, maintenance, dispatch, asset management, needs its own data contract that maps to a unified model. Without this, integration is perpetually temporary.
Centralising data without governing it creates a new silo, just a bigger one. Ownership, access controls, lineage tracking, and data quality rules must be built in from the start, not added later.
NTD submission, GTFS quality scores, ADA asset counts, these should flow from your data architecture automatically. If they require manual effort today, that manual effort is masking a structural problem.
This is the work, and it's overdue for most US transit networks.
If you're leading a transit or rail organization wrestling with fragmented data, compliance pressure, or the gap between your operational reality and your performance dashboards, this is exactly what we help solve at One Big Table. The first step is always the same: understand what you actually have before you decide what to build.
What data challenge is your network dealing with right now?
Read the original on LinkedIn